
Lumen Copper: Decarbonisation to 2035
A 34-slide board deck setting a staged $1.4bn plan to halve a copper producer’s Scope 1+2 emissions by 2035 and test what low-carbon copper can earn.
- Prepared for
- Board of Lumen Copper
- Length
- 34 slides
- Made with
- Whyston, exported to PowerPoint
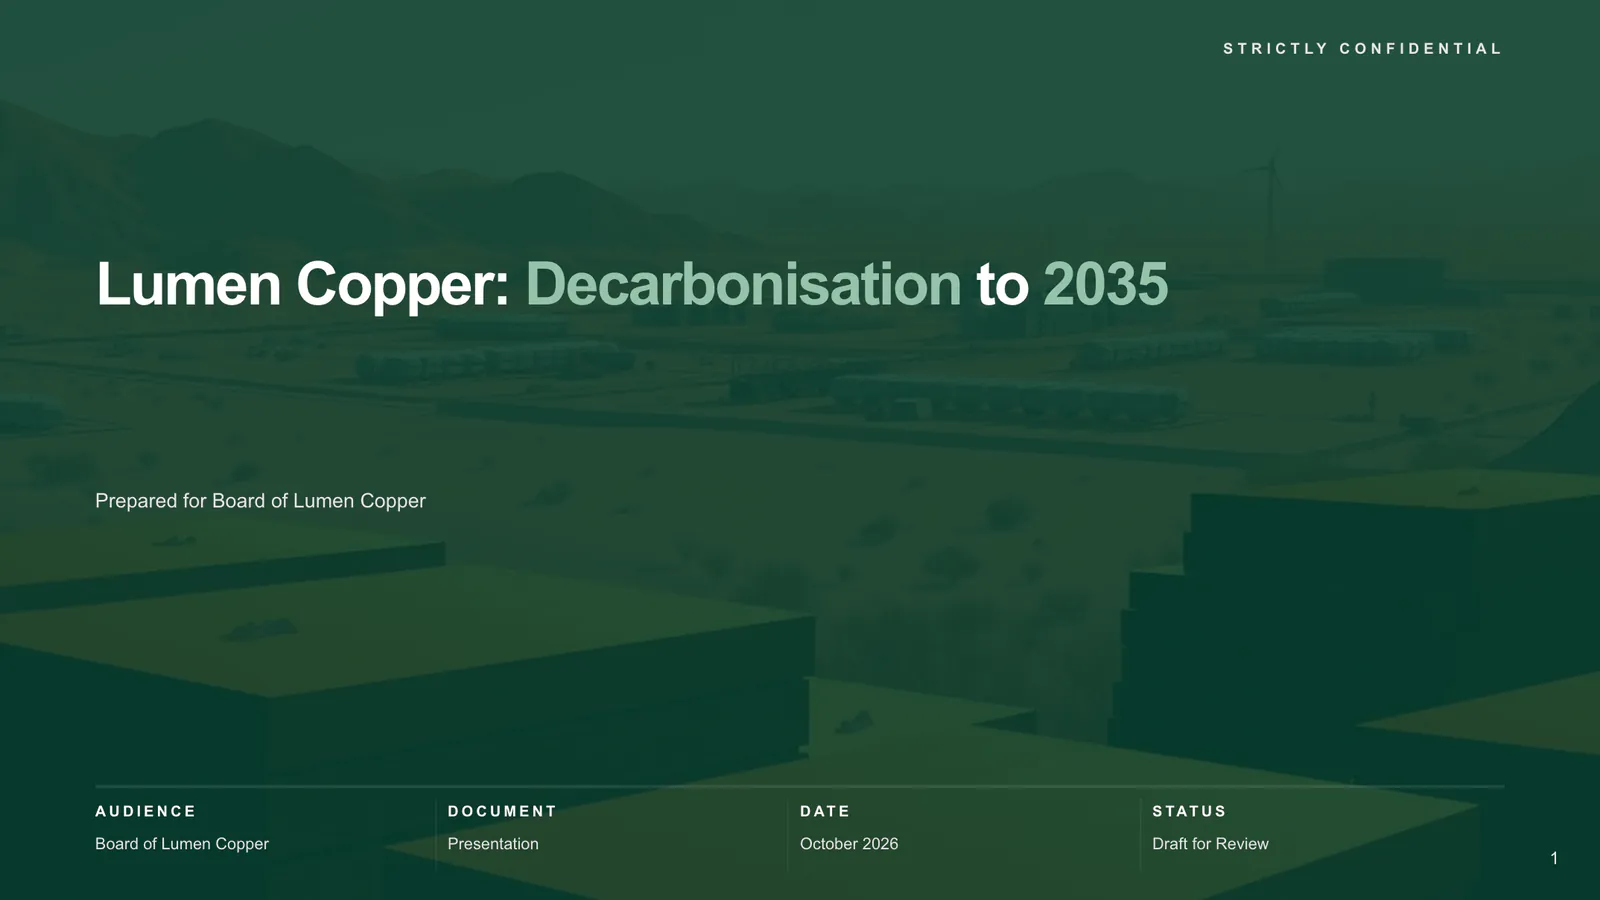
Slide 1 of 34
Lumen Copper: Decarbonisation to 2035
The brief, and what to look at
The brief
The board of a copper producer with operations in Chile and Peru asked how to halve Scope 1+2 emissions by 2035, what it would cost, and whether low-carbon copper earns a premium, using USGS, IEA and Ember data plus the company’s own figures.
What to look at
- An emissions bridge reconciles every abatement lever against production growth, from 1.05 to 0.49 MtCO2e (slide 19).
- The green premium is not assumed: only 20% of surveyed respondents report one, and premium revenue is shown as $0–24M scenarios on a 120 kt cathode ceiling (slides 7 and 24–25).
- The $1.4bn envelope is staged, with abatement cost per lever and a named owner for each release of capital (slides 27–28).
The executive summary
Written in SCQA order: the situation, what complicates it, the answer, then the pillars the rest of the deck proves.
- Situation
Chile and Peru supply 34.8% of mined copper on direct USGS estimates.
Lumen’s illustrative 420 kt output carries 1.05 MtCO2e of Scope 1+2 emissions.
- Complication
Fleet underdelivery leaves 0.61 MtCO2e, above the 0.525 Mt halving threshold
- Answer
Endorse a staged $1.4bn pathway targeting 53% lower emissions; underwrite premiums separately
- Supporting pillars
- Supply constraints and emerging differentiation reward credible low-carbon supply
- Power and haulage explain 83% of our emissions exposure
- Sequenced levers could reduce absolute emissions by 53%
- Verified cathode eligibility creates upside without assuming a premium
- Staged capital protects value while management proves delivery
The storyline, title by title
Every slide title in the deck, in order. Each one is a full-sentence claim, so the titles alone tell the story.
Strategic Case
Copper supply security matters, but premium evidence remains selective. Our strategy combines reliable delivery with measurable sustainability attributes rather than assuming a universal green premium.
- Copper’s 2035 primary supply gap reaches 22.6%
- Chile and Peru supply 34.8% of mined copper
- Only 20% of copper respondents report differentiated-material premiums
- Sector progress raises the bar as global emissions rise 9.1%
Baseline and Drivers
Illustrative company data establish a prioritisation hypothesis, not verified operating performance. Consistent boundaries and metered activity turn that hypothesis into an accountable baseline.
- Our 420 kt business starts at 1.05 MtCO2e
- Our intensity exceeds Antofagasta’s supplied reference by 31%
- Power and haulage create 83% of our emissions
- Metered energy and emissions factors determine our 1.05 Mt footprint
Abatement and Roadmap
Renewable power and efficiency lead; electrified haulage completes the halving case. The bridge reconciles growth and incremental savings, with no unmodelled Wave 3 benefit.
- Chile’s 38.14% wind–solar share outpaces Peru’s 6.52%
- Chile’s grid intensity rebounded 11.4% in 2025
- Four lever groups could deliver 0.64 Mt annual abatement
- Negative-cost levers cover 340 kt annual abatement potential
- Supplied levers reach 0.49 Mt, a 53% absolute reduction
- Wave 1 addresses 64% of gross abatement potential
Resilience and Commercialisation
Water and circularity strengthen resilience while product-specific evidence supports differentiation. Current cathode availability constrains the first offer before certification and buyer placement.
- Seawater reaches 80%; circularity strengthens resource resilience
- Build the 2029 offer on verified product evidence
- The 126 kt ambition exceeds current cathode by 6 kt
- The cathode ceiling could generate $12–24m annual premium revenue
Capital and Accountability
The $1.4bn envelope is a planning commitment, not unconditional expenditure. Technical performance, funding headroom and buyer evidence govern subsequent capital release.
- Stage $1.4bn; modelled abatement averages $14.9/tCO2e
- Assign $1.4bn oversight; retain fleet sanction with the Board
- Endorse staged investment targeting 53% lower emissions by 2035
The company at the centre of this deck is fictional, and figures marked illustrative in the deck are made up for the example. Public figures come from the sources listed on the deck’s Figures & Assumptions pages, which Whyston adds to every deck.
More examples
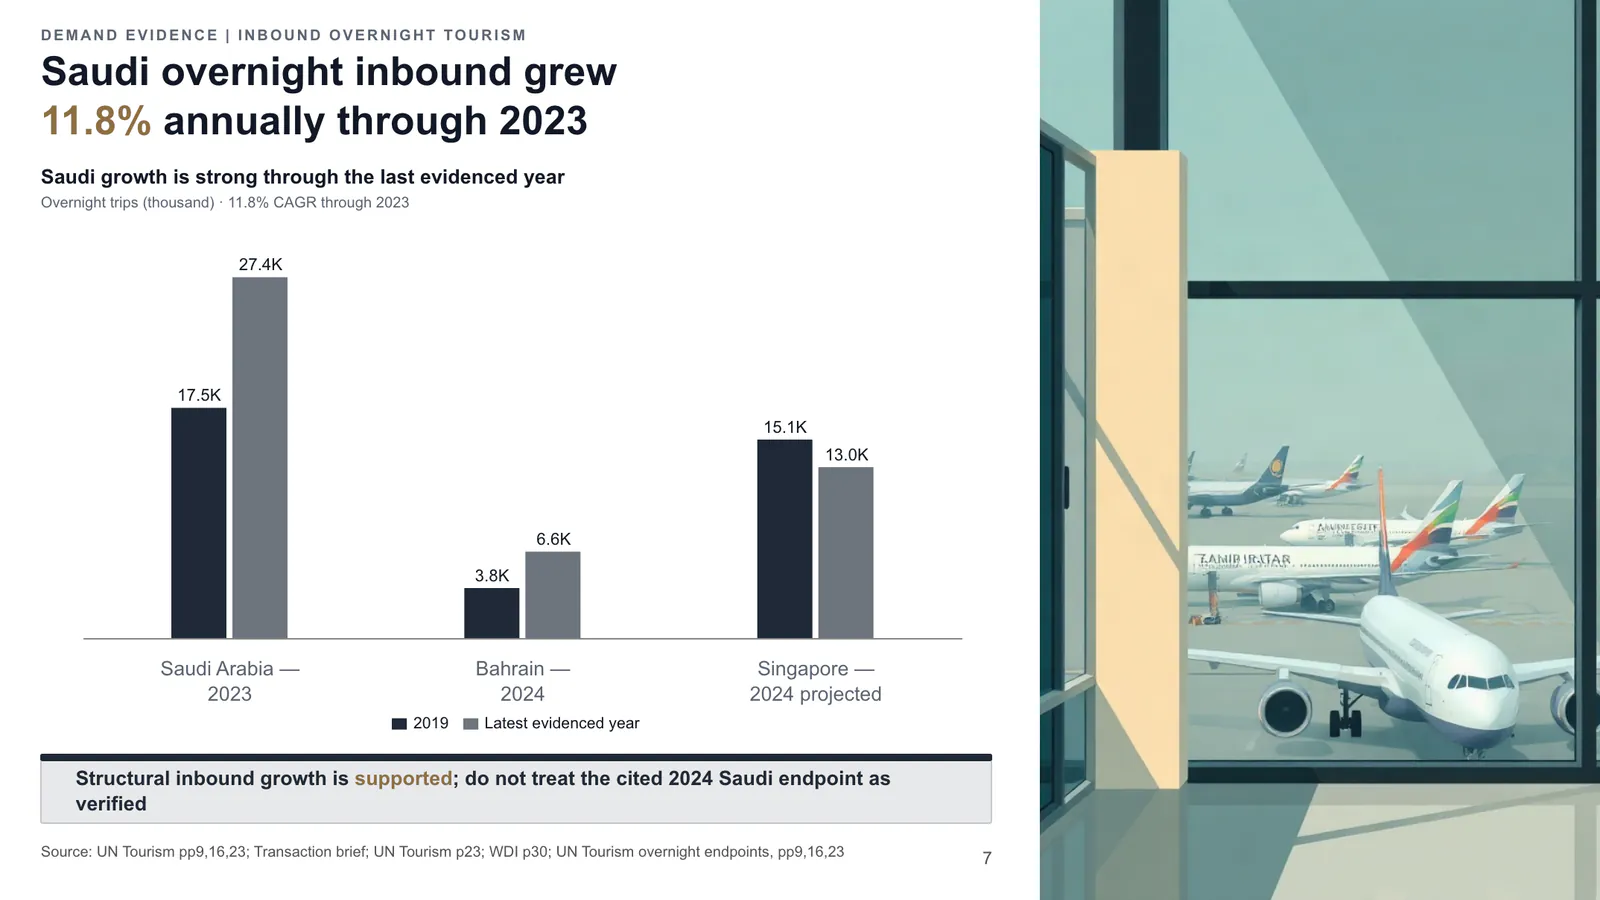 Project Meridian Commercial Due Diligence34 slides · Investment committee of a global private-equity fund
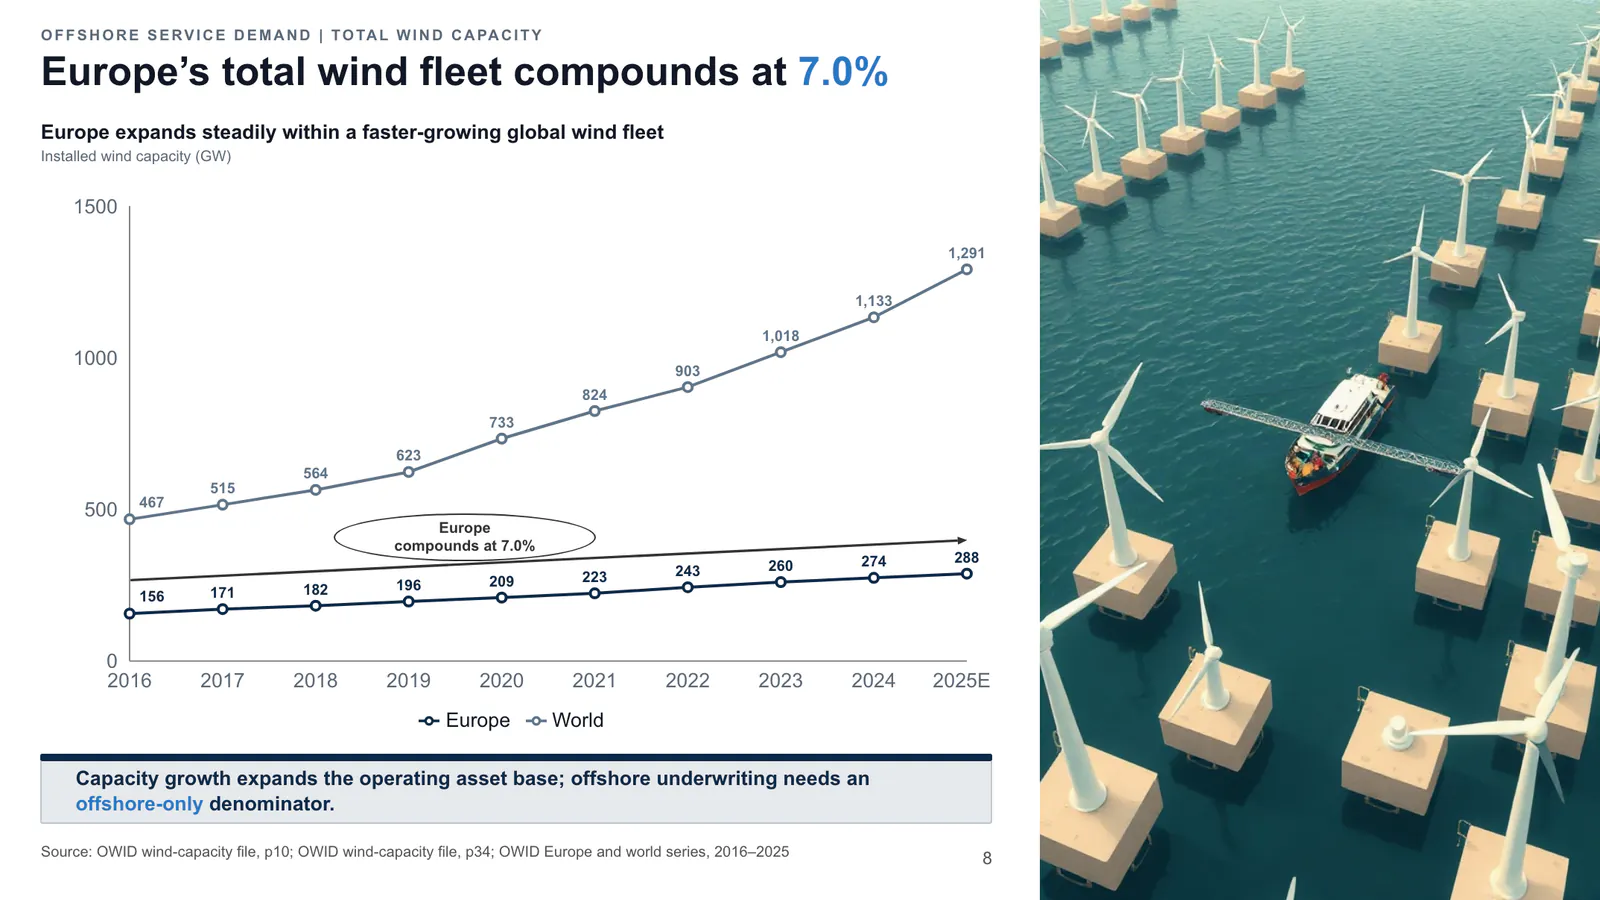 Project Aurora — Confidential Information Memorandum34 slides · Infrastructure funds, energy-transition private-equity funds and strategic buyers
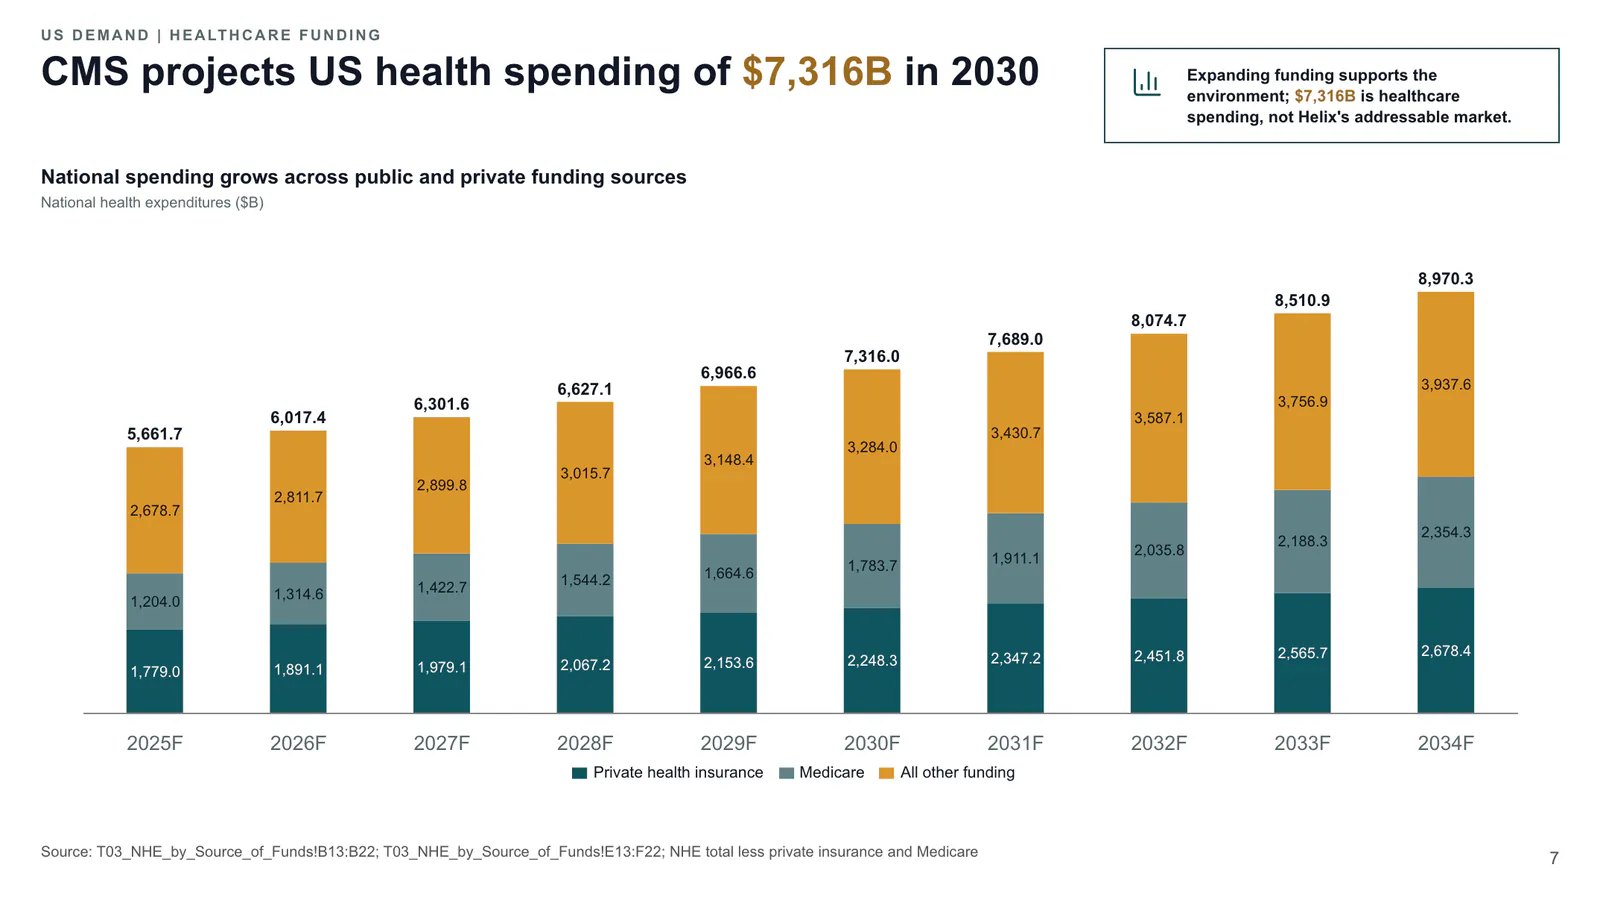 Helix Cardio US Entry Decision35 slides · Helix Cardio Board